Disclosure, to keep LaR happy. I am personally interested in the weather, it impacts my daily schedule and on days like yesterday results in snow getting over the top of my shoes. I am also interested because global warming is amongst the greatest threat to our future. Furthermore I am interested because natural resource prices tend to spike when its very cold and very hot. That being said you actually have to read the article and understand what it says before you have the right to comment.
I couple of the diagrams failed to import - you'll just have to go to TOD to see them. Despite quasi-official attempts to say we are just in a period of natural warming its worth looking at the reconstructed temperature graph showing just how much warmer the world is today than the last period of global warming - the medieval period. But then they did not have a/c, airplanes or cars then - apparently.
Kudos to The Oil Drum (link below).
Last month I provided a weather up-date and it was not my intention to provide updates on a regular basis. But the latest NASA temperature anomaly data for January I feel are worthy of comment. Why is this relevant to The Oil Drum? Well amongst other things, mild winter weather in the northern hemisphere reduces demand for natural gas and heating oil. Furthermore, a continuation of current trends may see tracts of molten permafrost render oil exploration and production impossible throughout vast areas of Siberia, Canada and Alaska. Melting of Arctic Sea Ice, on the other hand, may open up new offshore provinces.
Figure 1. Surface temperature analysis map for January 2007 from the Goddard Institute for Space Studies. The datum period for comparison is 1951 to 1980.
There are 8 more maps and charts below the fold.
[break]

Figure 2. January 2007. Goddard Institute for Space Studies.
Figure 3. December 2006. Goddard Institute for Space Studies.
Figure 4. January 2006 Goddard Institute for Space Studies.
Comparison December 2006 to January 2007
- The warm anomaly over Asia and Europe has expanded and intensified between December 06 and January 07 (comparing Figures 2 and 3). Note that the upper scale band for January is 4 to 11.6 degrees compared with 4 to 8 degrees in December. The North Pole is 4 to 11.6 degrees warmer compared with the datum period (Figure 1).
- The Antarctic in December was cooler compared with the datum period but in January it too is now showing positive temperature anomalies.
- There are a few cool spots in January, notably North Africa, Arabian peninsula, SW USA and Mexico, Australia and East Siberia. But these are dwarfed by the massive, large positive anomaly over Asia, Europe and the Arctic
- In January 06, Russia and Europe experienced anomalous cold weather that threatened gas supplies and sent gas prices soaring. This is in stark contrast to January 07 (comparing Figures 2 and 4). Temperatures over a vast area appear to be somewhere between 8 to 20 degrees warmer this year compared to last year.
- North America was somewhat cooler this January compared to last year.

Figure 5. 2000 to 2006, mean January anomalies. Goddard Institute for Space Studies.
Figure 6. 2000 to 2006, zonal mean January anomaly. Goddard Institute for Space Studies.
Figure 7. 2000 to 2006, zonal mean September anomaly. Goddard Institute for Space Studies.
It is worth taking a broader look at 21st century warming. Figure 5 shows the mean January anomalies from 2000 to 2006 compared with the datum period (1951 to 1980) and Figure 6 charts these mean temperature anomalies by latitude. It is clear that the anomalies dicussed above for December 2006 and January 2007 are part of a broader trend.
Note that January temperature rises are not evenly distributed. All latitudes north of 60 degrees south have experienced January warming, but the amount of warming increases as you go north. An average global increase in the period of a fraction of a degree masks the fact that high latitudes have warmed by over 2 degrees C during the northern hemisphere winter (Figure 6).
The late summer (September), northern hemisphere anomaly (Figure 7) shows warming across the whole planet of 1 to 2 degrees C. Late summer warming of 1 to 2 degrees in the arctic regions of Canada and Russia is unlikely to have a catastrophic effect on melting permafrost - yet. This will be the subject of a follow on post.
Food for thought
Figure 8 shows a temperature reconstruction for the past 2000 years. Note that the temperature range from the peak of the Medieval warm period to the trough of the Little Ice Age is around 1 degree C.
Figure 9 shows various temperature forecast scenarios for the next 100 years from the newly published IPCC summary report (pdf). Warming forecasts vary from 1.8 to 4.0 degrees C.
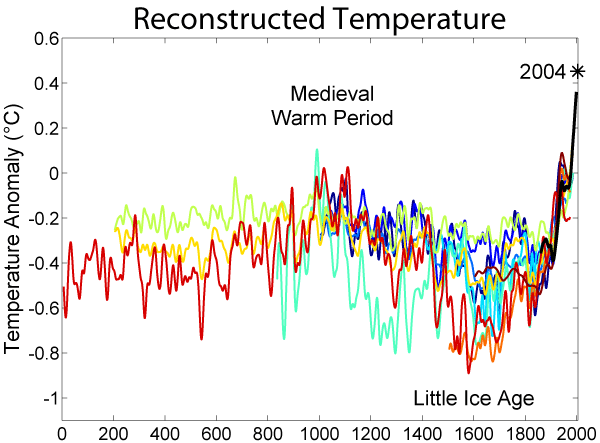
Figure 8. Temperature reconstructions for the past 2000 years from Wikipedia.
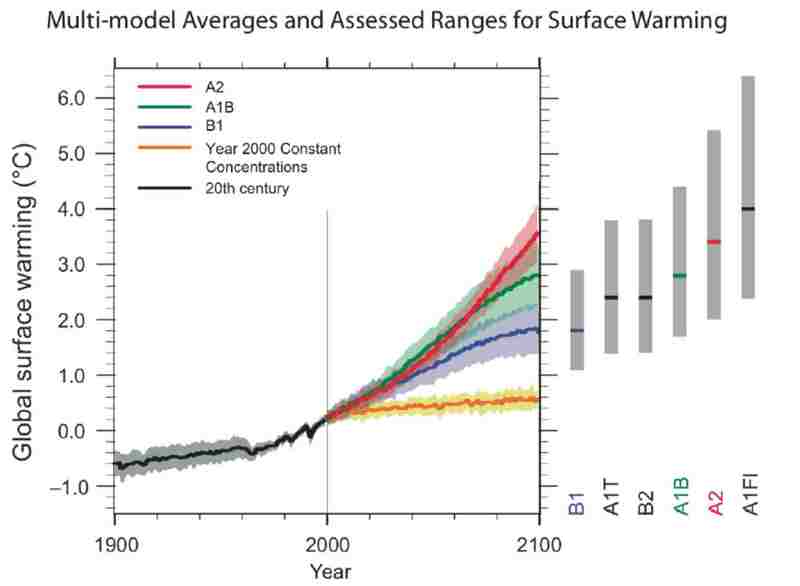
Figure 9. Temperature forecasts for 6 different scenarios considered by the IPCC (Summary report for Policymakers, Figure SPM-5: pdf).
At this point it was my intention to discuss what are in my opinion certain critical factors for the global warming debate that go beyond the physics of radiative forcing that was discussed by Stuart last year:
- Orbital / Milankovitch cycles
- Solar / sunspot cycles
- Loss of Arctic sea ice / reduced albedo
- Melting Arctic permafrost
Technorati Tags: global warming, TOD, Weather


No comments:
Post a Comment